D
ata analysis plays a crucial role in the success of entrepreneurs. By analysing quantitative data, entrepreneurs can gain valuable insights into their business operations, customer behaviour, market trends, and more. These insights can help entrepreneurs make informed decisions, identify areas for improvement, and develop effective strategies.
Data analysis allows entrepreneurs to identify patterns, correlations, and trends in their data. This enables them to understand the factors that contribute to their business performance and identify potential opportunities for growth. By leveraging data analysis techniques, entrepreneurs can optimise their operations, improve their products or services, and stay ahead of the competition.
In addition, data analysis helps entrepreneurs mitigate risks and make data-driven predictions. By analysing historical data and market trends, entrepreneurs can anticipate changes in customer preferences, industry dynamics, and economic conditions. This allows them to proactively adapt their strategies and make informed decisions to minimise risks and maximise opportunities.
Overall, data analysis empowers entrepreneurs with the insights they need to make informed decisions, optimise their business operations, and drive growth and success.
Common Data Analysis Methods for Entrepreneurs
Entrepreneurs have access to a wide range of data analysis methods to extract valuable insights from their data. Some common data analysis methods include:
- Descriptive statistics: This method involves summarising and describing the main characteristics of a dataset, such as mean, median, mode, and standard deviation. Descriptive statistics provide entrepreneurs with a clear understanding of their data.
- Inferential statistics: This method involves drawing conclusions and making predictions about a larger population based on a sample dataset. Inferential statistics help entrepreneurs make data-driven decisions and predictions.
- Regression analysis: This method examines the relationship between a dependent variable and one or more independent variables. It helps entrepreneurs understand how changes in one variable impact another.
- Time series analysis: This method analyses data collected over time to identify patterns, trends, and seasonality. Time series analysis helps entrepreneurs make forecasts and predictions based on historical data.
- Data mining: This method involves discovering patterns, relationships, and insights from large datasets. Data mining techniques, such as clustering and classification, help entrepreneurs uncover hidden patterns and make informed decisions.
These are just a few examples of the many data analysis methods available to entrepreneurs. The choice of method depends on the nature of the data and the specific goals of the analysis.
Tools and Technologies for Data Analysis
Entrepreneurs can leverage a variety of tools and technologies to perform data analysis effectively. Some popular tools and technologies for data analysis include:
- Spreadsheet software: Spreadsheet software, such as Microsoft Excel or Google Sheets, provides basic data analysis capabilities, including data manipulation, calculation, and visualisation.
- Statistical software: Statistical software, such as Python with libraries like NumPy and Pandas, offers advanced statistical analysis capabilities. These tools enable entrepreneurs to perform complex analyses and generate meaningful insights.
- Data visualisation tools: Data visualisation tools, such as Tableau or Power BI, help entrepreneurs create visually appealing and interactive charts, graphs, and dashboards to communicate their data insights effectively.
- Machine learning platforms: Machine learning platforms, such as TensorFlow enable entrepreneurs to apply machine learning algorithms for predictive analysis and pattern recognition.
- Cloud-based analytics platforms: Cloud-based analytics platforms, such as Amazon Web Services (AWS) or Google Cloud Platform (GCP), provide scalable and flexible infrastructure for storing, processing, and analysing large datasets.
These tools and technologies empower entrepreneurs to efficiently analyse their data, uncover actionable insights, and make data-driven decisions.
Data Visualization Techniques for Entrepreneurial Insights
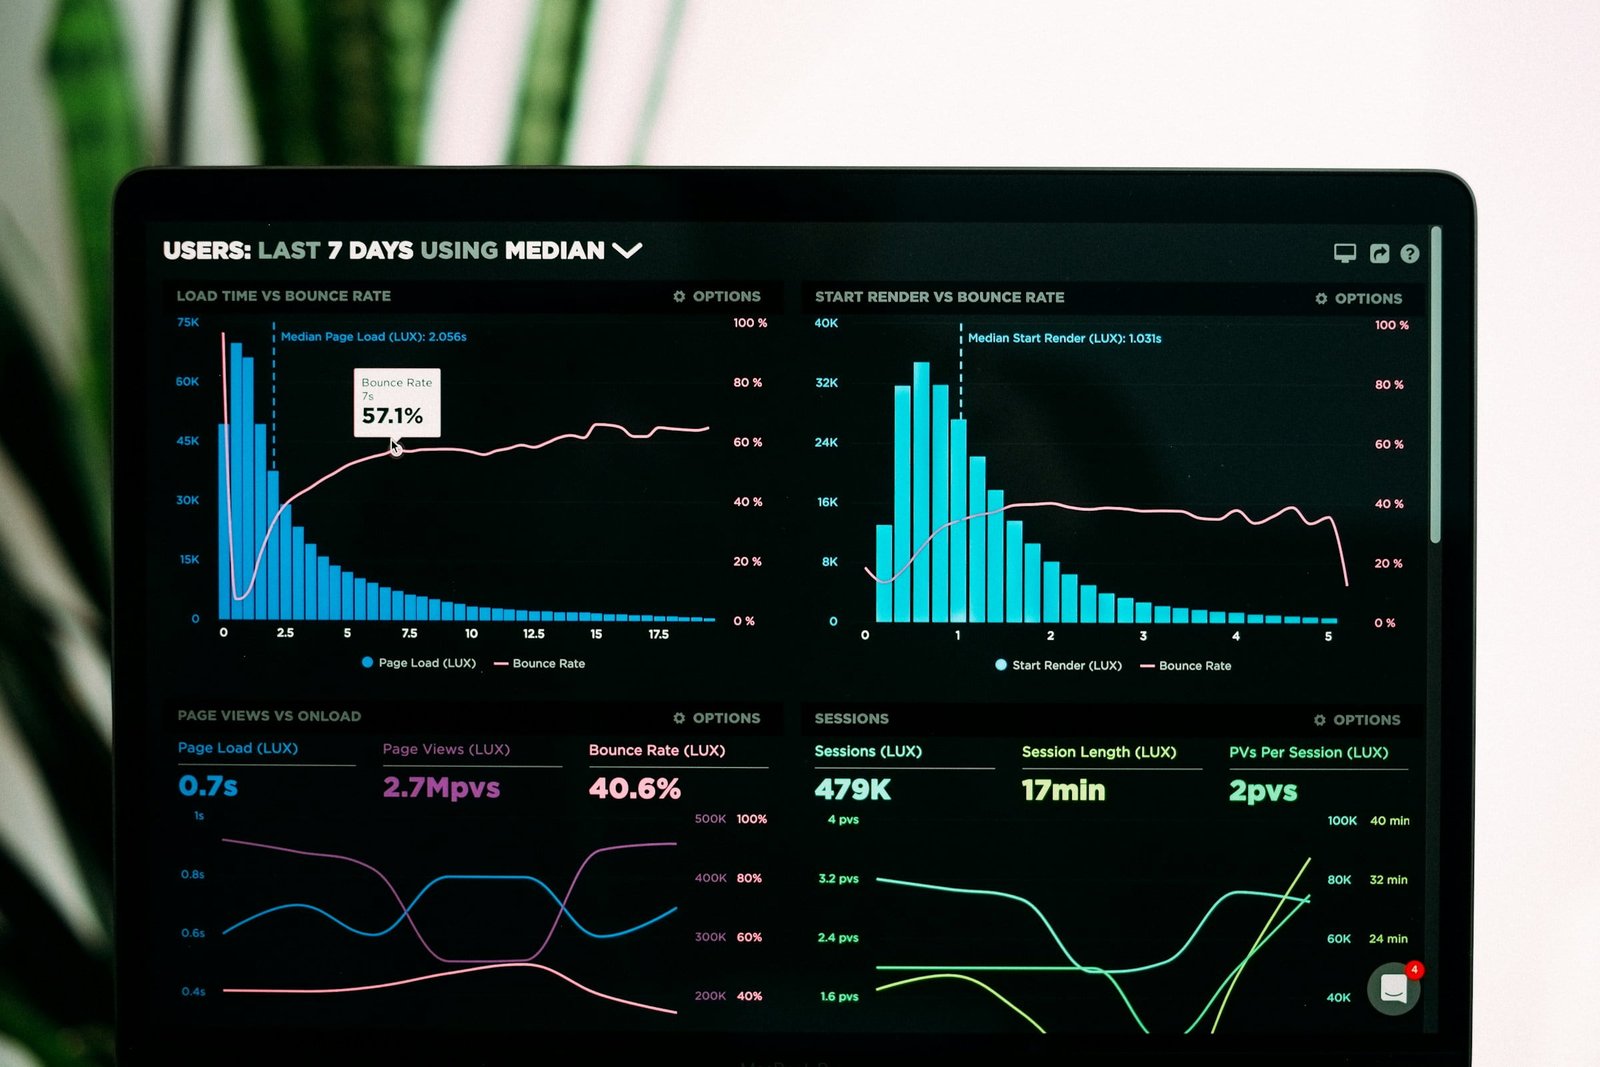
Data visualisation is a powerful technique for entrepreneurs to communicate their data insights effectively. By presenting data visually through charts, graphs, and infographics, entrepreneurs can convey complex information in a more understandable and engaging way.
Some common data visualisation techniques for entrepreneurial insights include:
- Line charts: Line charts are useful for displaying trends and patterns over time. Entrepreneurs can use line charts to visualise changes in key metrics, such as revenue or customer satisfaction, over a specific period.
- Bar charts: Bar charts are effective for comparing categories or groups. Entrepreneurs can use bar charts to compare sales performance across different products or regions.
- Pie charts: Pie charts are ideal for representing proportions and percentages. Entrepreneurs can use pie charts to show the market share of different product categories or the distribution of customer demographics.
- Scatter plots: Scatter plots are used to visualise the relationship between two variables. Entrepreneurs can use scatter plots to identify correlations and outliers in their data.
- Heat maps: Heat maps are effective for displaying large amounts of data. Entrepreneurs can use heat maps to identify patterns or clusters in their data, such as customer segmentation or geographical distribution.
These are just a few examples of data visualisation techniques that entrepreneurs can use to gain insights from their data and effectively communicate their findings to stakeholders.
Implementing Data Analysis Strategies in Entrepreneurship
To effectively implement data analysis strategies in entrepreneurship, entrepreneurs should follow a systematic approach:
- Define clear objectives: Clearly define the objectives and goals of the data analysis. Identify the specific questions you want to answer or the insights you want to gain.
- Collect relevant data: Gather the necessary data to perform the analysis. Ensure that the data is accurate, complete, and relevant to the objectives.
- Clean and preprocess the data: Clean the data by removing duplicates, correcting errors, and handling missing values. Preprocess the data by transforming variables, normalising data, or aggregating data if necessary.
- Choose appropriate analysis methods: Select the most suitable data analysis methods based on the objectives, data type, and available tools. Consider the strengths and limitations of each method.
- Analyse the data: Apply the chosen analysis methods to the data. Interpret the results and draw meaningful insights. Identify patterns, correlations, trends, or anomalies in the data.
- Visualise the insights: Use data visualisation techniques to present the insights visually. Create charts, graphs, or dashboards that effectively communicate the key findings.
- Make data-driven decisions: Use the insights gained from the analysis to make informed decisions and develop data-driven strategies. Monitor the impact of these decisions and iterate as needed.
By following these steps, entrepreneurs can effectively leverage data analysis to drive business decisions, optimise operations, and achieve their entrepreneurial goals.


